Hyperspectral image (HSI) unmixing |
|
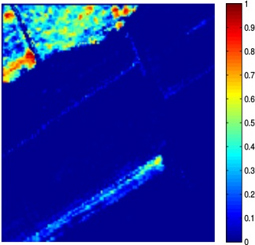
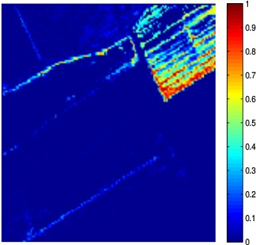
Nowadays, spectral unmixing algorithms that exploit not only the spectral but also the inherent spatial information of hyperspectral images have notably flourished. Actually, under the assumption that the endmembers present in the image are known a priori, the unmixing problem concerns the estimation of the abundance matrix, whose entries correspond to the abundance values of the pixels inside a window in the spatial dimensions of the image. Herein, we developed two spectral unmixing schemes, a) an incremental proximal sparse and low-rank algorithm for hyperspectral unmixing, and b) a spectral unmixing algorithm based on the alternating directions method of multipliers. Both algorithms impose two major assumptions on the abundance matrix estimation problem, namely sparsity and low rankness. Sparsity is justified by the fact that not every endmember is present in each pixel, while low rankness is due to the homogeneity present in the spatial domain. To impose sparsity, the weighted l1 norm of the abundance matrix is utilized, while low rankness is taken into account through the weighted nuclear norm of the abundance matrix. The incremental sparse and low rank spectral unmixing algorithm (IPSpLRU) algorithm proceeds by incrementally minimizing each term of a suitably formed optimization function separately. Departing from IPSpLRU, the alternating directions sparse and low rank unmixing algorithm (ADSpLRU) operates on the extended Lagrangian function of the optimization problem and manipulates the whole cost function instead of treating each term individually. As it can be observed from the abundance maps (corresponding to grapes and a type of brocolli) obtained after applying IPSpLRU and ADSpLRU to a real hyperspectral dataset, i.e. the Salinas Valley HSI acquired by AVIRIS sensor, the proposed algorithms are comparable, indicating the existence of the selected endmembers at the same regions of the hyperspectral image. |
|
|
(a) grapes, IPSpLRU |
(b) brocolli, ADSpLRU |
|
(c) grapes, ADSpLRU |
(d) brocolli,ADSpLRU |
Figure: Abundance maps obtained by IPSpLRU (a)-(b) and ADSpLRU (c)-(d) on the Salinas Valley dataset.
|
|
Achievements


